 |
 |
|
| Jim Worthey • Lighting & Color Research • jim@jimworthey.com • 301-977-3551 • 11 Rye Court, Gaithersburg, MD 20878-1901, USA |
|
|||||||
|
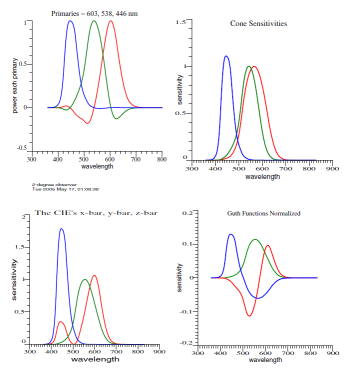 |
| This is a mini version of Fig. 1 in the Vectorial
Color manuscript. At upper left is a set of color-matching
data as they might appear an experiment, and next comes
human cone sensitivities. Then the familiar x-bar, y-bar,
and z-bar are displayed, and the last graph shows a set of
opponent-color functions. |
|
| This is a mini version of Fig. 1 in the
Vectorial Color manuscript. At upper left is a set of
color-matching data as they might appear an experiment,
and next comes human cone sensitivities. Then the
familiar x-bar, y-bar, and z-bar are displayed, and the
last graph shows a set of opponent-color functions. |
|