|
Lighting
Quality and Light Source Size
James
A. Worthey, PE, PhD
When we see an
object, the information that the eye receives results from the optical
interaction of the object's surface with the light striking the
surface. Potentially, every detail of the object's optical environment
has an effect on the way that its surface properties are revealed. For
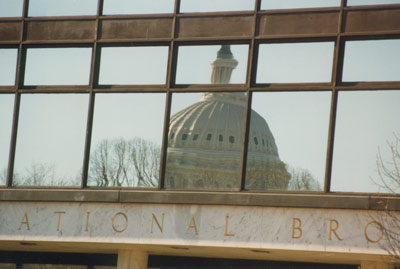
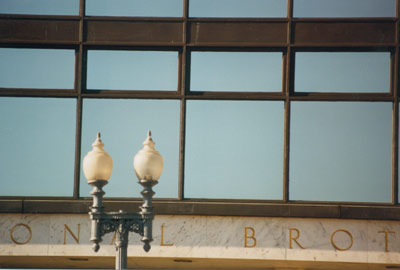
example, the first two photos show a bank of windows on the Teamster's
Union headquarters in Washington, D.C., from two different vantage
points. When the dome of the US Capitol is imaged in the glass, you see
three things: that the windows are mirrored; that the Capitol Dome is
imaged in the mirrors; and that the mirrors must not be perfectly flat,
because of the distortion of the reflections.
When the windows'
mirror coating images only the sky, you cannot be
sure that they are mirrored, and there is no clue that they are not
flat.
Are we to conclude
that the "illuminant" for the mirrored windows is the Capitol dome, and
that the mind compares its remembered image of the dome with the
distorted mirror image, and makes an inference about the non-flatness
of the glass? The answer is obviously yes. The eye is a sophisticated
detector connected to a sophisticated brain, and we "see" the
distortion of the glass instantly, but only if the information becomes
available because of contrasts in the glass's environment.
The mirror is a
curious example of an illuminated object, because its contrasts are
those of the rest of the environment, however great or small those may
be. The flat or almost-flat mirror is an extreme example, but not a
trivial one, because many objects are mirror-like to a greater or
lesser degree. Metallic objects, such as Christmas-tree ornaments, may
be as shiny as a mirror, but are not flat. A wine glass has a shiny
surface but is also transparent, so that it acts as both a distorting
mirror and a distorting lens. Thus, the simple mirror illustrates an
important principle: contrasts beget more contrast.
The example of the
distorted mirror plus the US Capitol shows another principle, as
already implied. If the object displays visual cues---almost any kind
of contrast---the human visual system probably can interpret the cues
in some useful (and correct) way. A whole article could be devoted to
examples supporting this principle, but the important thing here is
that it might be a useful and non-trivial axiom for engineering
analysis. At present, for instance, robot vision systems are highly
specialized and limited, and could be counted on to make no sense of a
distorted image of the Capitol, or of most other scenes. With humans,
an engineer who just tries to provide the contrast is on the right
track. She can safely assume that the eye will make use of all
contrasts. A series of interesting articles could also be devoted to
the question of how one would "count up" the contrasts in a complex
scene, but let's move on.
Another unusual example
The third photograph again shows that everything about a light source
matters. The photo is of the mottled shadows seen beneath a deciduous
tree on a sunny day. The usually circular bright spots are
peculiar in this picture however. Each bright spot is like a cookie
with a bite taken out of it.
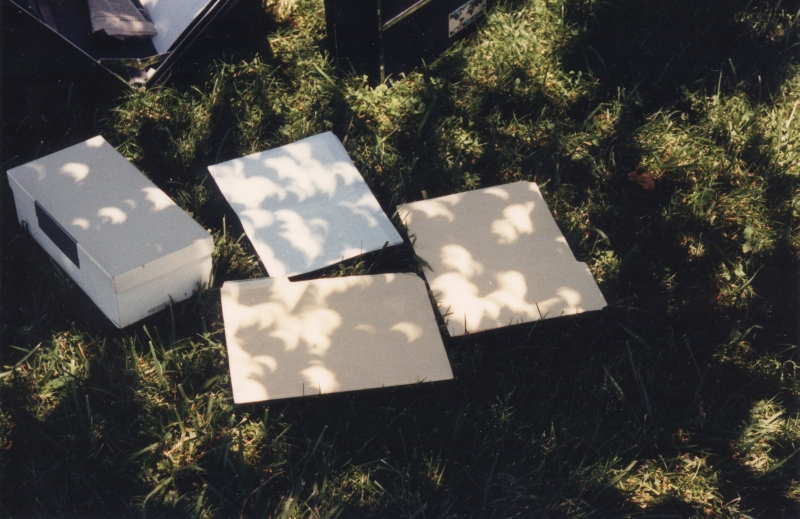
The picture was taken in Cleveland, NC, during the annular solar
eclipse of May 30, 1984, perhaps a half-hour after the moment of
annularity. We see that the usual circular light spots do not just happen: they are in effect,
pinhole-camera images of the sun. To generalize, we may say that where
cast shadows are concerned, the exact size and shape of the light
source matter: Even the sun, which is one of the smallest familiar
sources, cannot be treated as a mere point.
Source size
Now if contrast begets contrast, and contrast is usually useful,
it makes sense to ask how contrast can be introduced into a scene. This
question has many answers involving such topics as interior design and
color rendering.1 The remainder of this paper focuses on
just one parameter, the size of the light source. Familiar lights vary
greatly in area, as seen in Table 1.2
This table shows that lights vary in the solid angle they
present---their "visual area"---by a factor of at least a million.
Table
1---Light source sizes
|
Light
Source
|
Area,
(m2)
|
Solid
Angle at 2 meters distance, microsteradians
|
Unfrosted
60 W incandescent bulb
|
2.0×10⁻⁵
|
5
|
The
Sun (distance = 93 million mi)
|
1.5×10¹⁸
|
67
|
Ordinary
frosted 60-W incandescent bulb
|
3.1×10⁻⁴
|
79
|
Soft
White 60-W incandescent bulb
|
2.4×10⁻³
|
590
|
F40T12
fluorescent tube
|
4.6×10⁻²
|
12,000
|
Luminous
ceiling, extending to ∞ (2π steradians)
|
many
|
6,300,000
(2π million)
|
Much can be learned
about the effects of light source size from the simplified apparatus of
Figure 1.
The test object shows the essence of the veiling reflections: The black
glass acts as a partially reflecting mirror, forming clear images, but
with only 4 percent the luminance of the thing imaged.
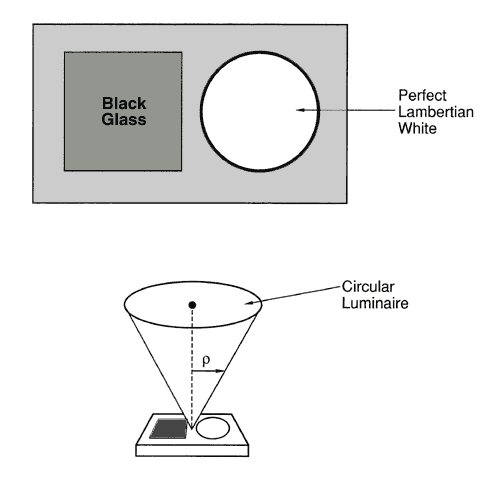
|
Figure 1---Idealized apparatus for
thought experiments concerning source size. A test object consists of a
flat piece of black glass mounted next to a diffusely-reflecting
(Lambertian) white surface. The test object is positioned under a
circular luminaire of uniform luminance.
|
The white area next to it reflects all the light that strikes it, but
diffusely. If a light-source image is visible in the black glass from a
particular vantage point, that's a veiling reflection. A simple measure
of veiling reflection amplitude is the gray level of the black glass,
that is the luminance of the source image, divided by the luminance of
the white area.
We assume that only a single light source llluminates the white
surface, a circular uniformly bright area which subtends an angle 2ρ
and is centered over the test object, as shown at the bottom of Figure 1. We assume that everything
is centered vertically, including the viewer's eye, but we ignore any
effect of the viewer's head blocking the light.
Basics
of veiling reflections
Let us now review some results related to veiling reflections. Details
are available in recent publications.2,3 For the apparatus
of Figure 1, the gray level of
the black glass is
g = 0.04
/ sin2ρ
(1)
where g is the gray level. For a light source that covers the
hemisphere above the test object, ρ = 90 degrees. The gray level is
then 4 percent, which is not negligible because it may be high,
relative contrasts that are being veiled, and because of the
non-linearity in the way the eye sees lightness. The constant 0.04 in Equation 1 is a typical value based
on a convenient value for the refractive index of the black glass.3
Veiling
reflections and color
A look at veiling reflections in colored objects reinforces the view
that such reflections are never negligible. Again, recent work on this
topic2 will be summarized. The eye sees colored objects in
comparison to a white object, even if the white object is not there.
Furthermore, the eye responds nonlinearly to color variation, so that a
small physical change in a color stimulus has a bigger visual effect
when the starting point is a dark gray or a deep color. All these facts
and more can be summarized by a color solid, which is a
three-dimensional representation of the range of colors that people can
see.
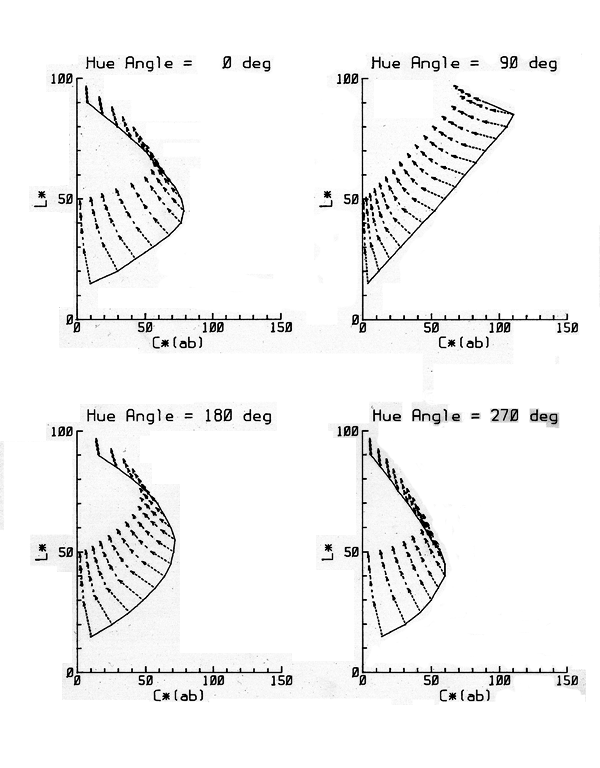
|
Figure 2---Reduction in the range of
lightness and saturation of surface colors due to veiling reflections.
Data are plotted in the cylindrical-polar version of the CIELAB uniform
color space, at four selected hue angles (h*). Radial coordinate c*
represents saturation, while axial coordinate L* is a measure of
lightness. The solid lines represent the limits attainable with real
pigments. Chains of arrows show successive shifts as veiling reflection
is increased to 4, 8, 12, and 16 percent of white. At all hue angles,
including those not shown, a similar systematic loss of saturation and
of lightness occurs.2
|
Several variations on the basic idea of a color solid are in use by
visual scientists and practical color users such as designers, all
meant to represent the same facts. The so-called CIELAB uniform color
space provides a convenient basis for drawing the color solid when
calculated results are important, since it is defined by formulas. Figure 2 shows four radial slices
through the color solid in CIELAB space. The vertical axis represents
the variation from black, at the bottom, to white, at the top. Each
graph represents a particular hue, and the abscissa is the radial
coordinate, corresponding to the saturation of colors. The solid line
in each graph is the limit of practical colors in that plane, according
to data of Pointer.4 The chains of arrows show the effect of
veiling reflections in successive increments of 4 percent. The net
effect of veiling reflections is to reduce the volume of the color
solid. For instance, the initial 4 percent veiling reflection,
corresponding to spherical lighting, shrinks the range of colors seen
by 37 percent.2 Again, this shows that veiling reflections
are never negligible. Having reviewed two recent papers at some length,
we now move on to new material.
Source
luminance
The lights in Table 1 were
chosen on the basis that each approximates a familiar lighting
situation. They would not give equal illuminances. Although this
intuitive approach shows that lights do vary greatly in size, there is
a deeper reason that familiar sources vary in solid angle. The size
variation must occur because of the tremendous variation in luminance.
Refer again to Figure 1. Let E
be the illuminance at the object under the circular source, and let L
be the lominance of the source. Then, taking a standard formula for
illuminance and making semi-subtense the dependent variable tells us
that
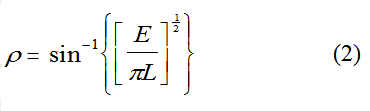 . .
A short
calculation gives the solid angle Ω subtended by the circular source:
Ω =
2π(1-cosρ) . (3)
[Applying
a trig identity puts Eq. (3) in an improved form: 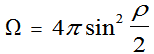 . Original article
had Eq. (3) as above.] . Original article
had Eq. (3) as above.]
Equations
2 and 3 express exactly
the tradeoff between source luminance and source size. Repeated use of
the small-angle approximation lets us combine and simplify to get
 .
(4)
This is just what intuition would say, that to increase illuminance on
the task (E) one must increase the light's size as seen from the task
(Ω), but if you can use a source of higher luminance (L), then you can
make it smaller. Taking the small angle approximation in Equation 2 and electing to express ρ
in degrees gives
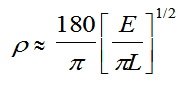 .
(5)
For many
purposes, the approximations of Equations
4 and 5 are sufficient,
as we shall see.
Table 2 lists the luminances of various light sources and the
corresponding size that the circular source of Figure 1 must have in
order to give E = 1000 lx. Size is given both as ρ in degrees or
minutes of arc, and as Ω in microsteradians. All luminances are taken
from Reference 6. Note that
the solid angles are not the actual solid angles of the lights as in Table 1, but are the solid angles
that would be necessary to give 1000 lx on the task.
Table
2---Actual source luminances and the corresponding size that would be
necessary for 1000 lux on the task in Figure 1.
|
Source
|
Luminance
[cd/m2]
|
ρ
[deg]
|
Ω
[microsteradians]
|
Sun
|
1.5×10⁹
|
1.58
min
|
0.67
|
Carbon
arc, maximum
|
109
|
1.94
min
|
1
|
Carbon
arc, minimum
|
1.5×10⁸
|
5
min
|
6.6
|
Tungsten,
vacuum
|
2×10⁶ |
43.4
min
|
500
|
Tungsten,
inside frost
|
1.2×10⁵ |
2.95
deg
|
8300
|
Cool
white fluorescent
|
7×10³ |
12.3
deg
|
140,000
|
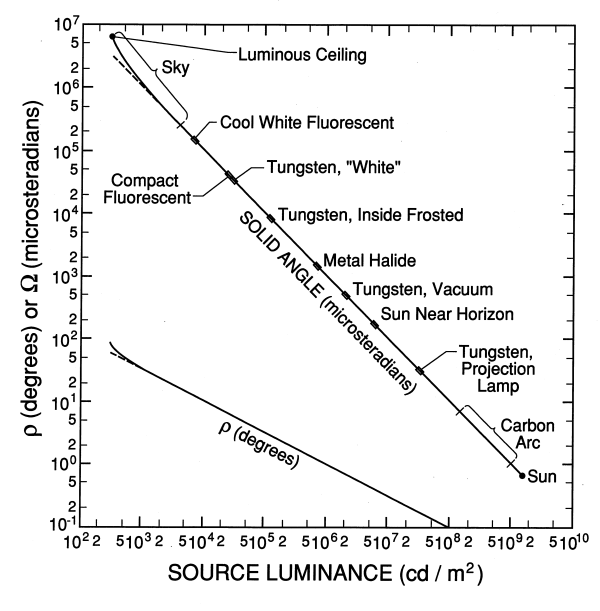
Figure 3
will help to illustrate Equations 2-5 and Table 2. The graph shows how
light-source size varies with luminance, for a fixed assumption of 1000
lx on the task. Source luminance is on the x-axis, while the y-axis is
left unlabelled because two dissimilar quantities are graphed, the
solid angle Ω covered by the circular source and the angular radius ρ,
that it subtends. The solid curves, based on Equations 2 and 3 are exact given the assumption of
a circular uniform source, symmetrically positioned.
|
Figure 3---Variation of light source
size with luminance. As indicated on the face of the graph, the upper
solid and dashed curves represent solid angle (Equations 2 and 3), while the lower solid and dashed
curves are semi-subtense (Equations 4
and 5). [This version of the figure has a
couple additional light sources not in the printed article.]
|
There are clear limits on the range of luminances, which has been
indicated by terminating the graph of solid angle with circles. The sun
when directly overhead in a clear sky has the highest luminance of any
familiar source. At the other extreme, a luminous ceiling which covers
the hemisphere above the work and has a luminance of 1000/π [candelas/m2]
is the dimmest source that can give an illuminance of 1000 lx. Setting
a lower figure for illuminance would lengthen the graph, but the same
principle would apply.
Obviously, the solid angles given for the various sources in Table 2 and Figure 3 are not the solid angles
that these sources actually subtend, but the solid angle that they
would need to subtend in order to give 1000 lx on the task in Figure 1. Comparison of Table 1 and Table 2 shows that only one 1/100 of
the full sun area is needed to give 1000 lx, for instance. Further
comparison shows that the solid angle of fluorescent tube required to
give 1000 lx is about 100 times that of the real sun. This shows what
is known intuitively, that where "sparkle" is concerned, meaning the
compactness and luminance of highlights and the sharpness of cast
shadows, the fluorescent lamp cannot compete with the sun. On the other
hand a fluorescent tube or luminaire showing the luminance of a
fluorescent tube need cover only 140,000 microsteradians, or about 1/40
of the hemisphere above the object, in order to provide a respectable
illuminance of 1000 lx. If such a light were positioned next to a large
dark area, a small tipping of the task could eliminate the veiling
reflection.3 As a basis for understanding luminaire design
and application, Equations 2-5
can be used in conjunction with the optical principles limiting image
luminance. An aerial image of a source has the luminance of the source,
reduced by any losses or partial reflections along the path.5
It is quite possible for a luminaire, within a certain range of viewing
angles, to show a luminance approaching that of the source. It is not
posssible, however, to make an "optical funnel" that brings all the
source rays together in a small area in order to present a higher
luminance than that of the sources.
Therefore, the solid angle of Equation
3 presents a simple goal for luminaire designers. No luminaire
can present a smaller bright area; one that approaches it can be
considered compact for the specified source. If the illuminance E used
in Equation 3 to evaluate the
luminaire is in fact the task illuminance needed in a complete
installation, then it follows that only one luminaire need shine on the
task. This is desirable from the point of view of veiling reflections,
so the real working illuminance can and should be used in evaluating
luminaire compactness. Referring to Table
2 and remembering the definition of solid angle, Ω = A/r2,
we see, for example, that 1000 lx on the task from a single bright area
with the luminance of a fluorescent tube requires that area to be 0.56 m2.
A lower illuminance would permit a smaller area, as would a lower
ceiling. Using focused luminaires so that each task only sees one or
two compact sources implies that the luminaires must have sharp cutoffs
in their photometric distributions. Such luminaires are often sought in
order to reduce direct illumination of the eye. The present analysis
shows other distinct effects of focused luminaires. Technically, Equations 2-5 apply only to the
circular source of Figure 1.
However, it is more than plausible that Equation 4, which expresses a simple
conservation-of-flux principle, would be valid for other shapes, so
long as their semi-subtense in the longest dimension did not exceed
about 35 degrees, the size at which the approximate formula begins to
be inaccurate. This technicality can be examined in the future.
At this point, many readers may note that I am using optical principles
that are well known to luminaire designers, and perhaps not even
explaining them very well. My goal, of course, is not to re-invent
optics itself, but to apply optical principles to questions of lighting
quality. In this same spirit, let us now take a look at the optics of
highlights.
Highlights
Highlights are images of a light source as imaged in the surface of a
shiny object, whether the object is metallic or dielectric. The term is
apt because highlight luminance, even in a dielectric object, can be
quite high when the source is small. For instance, applying Equation 1 when the sun is the
source shows that highlight luminance is some 2000 times the luminance
of a white. While we could consider a luminaire's image in a plane
mirror to be a highlight by definition, highlights are of particular
visual interest in curved surfaces, even highly curved surfaces. For
instance, highlights tend to pile up on the rim of a glass tumbler. If
the source is small, this highlight region gives high contrast and
serves to localize sharply an important detail of the glass. As for the
luminance of such a highlight, it is equal to the source luminance
times a reflected fraction that we can take to be 0.04 for dielectric
objects3 (as in Equation 1).
The highlight luminance does not depend on surface curvature, so long
as the surface is shiny.
What does happen as surface curvature increases is that the reflection
(image) of the source gets smaller. Let us do a thought-experiment with
mirrors. Imagine that it is night, the sky is clear, and the moon is
full. We have a flat mirror, tipped so that we can see the image of the
moon. The moon's image will be 384,400 km behind the mirror and with a
diameter of 3476 km will subtend about 32 min of arc, the same as in
direct viewing. Since the moon's luminance is about 2470 cd/m2,
the image will have a luminance just a bit lower, say 2200 cd/m2.
Now in place of the plane mirror, put a mirrored sphere of 1 m radius,
in effect a very large Christmas tree ornament. The ball's diameter is
2 m; its focal length is 0.5 m. The moon's image is no longer so far
away; it is at the focal point, or 0.5 m below the surface of the ball.
The image size is now 4.7 mm. The image luminance is still 2200 cd/m2.
Now that the moon's image is nearby, we must know the eye's position in
order to find the angle that the image subtends. Assume that the eye is
0.5 m from the sphere's surface. Then the image subtense is
approximately 16 min. Now
let a series of smaller and smaller balls be substituted for the one of
1 m radius, always putting the ball's surface 0.5 m from the eye. The
moon's image will get smaller and smaller, while keeping the same
luminance. The image will always be 1/2 the radius below the surface,
1/4 of the way through the ball. When the ball is about 6 mm in
diameter, the moon's image will subtend only one min of arc, which is
about the resolution limit of the eye; 20/20 acuity means that details
of 1 min can be resolved. As the balls get smaller after that, the eye
no longer perceives the image to shrink, it only sees it getting dimmer.
Familiar objects are most often convex, with a wide range of
curvatures. In discussing highlights, it is of interest to know if the
source images often fall below the limit of resolution. Suppose that
you are designing the lighting for the Acme Shiny & Convex Co.,
which produces such items as ball-bearings, light bulbs and 1956
Oldsmobiles. You wish to choose between two light sources. If both
sources are so small that the common objects in the factory all give
highlights below the limit of visual resolution, then highlights will
look the same under both lights. Otherwise, the smaller source will
give smaller highlights of higher luminance.
Theory
of highlights
In order to write some equations describing highlights, let us define r
= radius of curvature of the object, d = viewing distance, eye to
object, σ = angular subtense of the light source at the object, α =
visual angle of the highlight.
Symbol σ is intended to represent the subtense of the light's long
dimension. Thus, if the source is the circular one of Figure 1, σ = 2ρ. As stated
before, the highlight will lie below the surface of a convex object at
depth r/2. Simple optics7 and repeated use of the
small-angle approximation gives
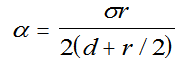 . (6)
α =
σr/(2d) .
(7)
Because
Equations 6 and 7 involve just two angles and two distances, they can
be interpreted in any two convenient units, such as minutes of arc and
millimeters. If a concave object's radius of curvature is taken to be a
negative number, these equations apply to it also. To use Equation 7, let us assume a fixed
viewing distance of 0.5 m, and a source-object distance of 2 m, then
compute the critical radius r, such that α = 1 min of arc. This results
in Table 3.
Table
3---Object radius for highlight to be seen as a point.
|
Light
source
|
Subtense,
min arc
|
Object
radius for α = 1 min arc, mm
|
The
Sun (distance = 93 million miles)
|
32
|
31
|
Unfrosted
60 W incandescent bulb
|
34
|
29
|
Soft
White 60 W incandescent bulb
|
95
|
11
|
F40T12
fluorescent tube
|
2034
|
0.5
|
| Luminous
ceiling, extending to ∞ |
10800
|
no
highlights
|
We see that when the source is the sun, many common objects such as
ball bearings fall below the critical radius, while many other objects
such as bowling balls fall above it. For other sources, even more
objects will be above the critical radius, meaning that the highlights
will have a perceptible size and shape.
Dynamic
range
The luminous ceiling gives nothing that can be called a highlight, only
a veiling reflection of gray level 0.04. With a small source,
highlights add to the contrast and dynamic range of a scene. Consider
the setup of Figure 1, but
assume realistically that there is a slight haze on the surface of the
black glass, so that its gray level away from the source image is 0.01,
rather than 0.0.
Table 4
shows the variation in highlight luminance and dynamic range of the
test object, as the lighting is changed. Again in this table, lights,
other than the sun, are 2 m overhead. Highlight luminance is expressed
as a multiple of the white area's luminance. Except in the case of the
luminous ceiling, the maximum and minimum luminances both occur in the
black glass. Under the luminous ceiling, the highest luminance is the
white, while the black glass is covered by an unavoidable veiling
reflection. Dynamic range means the ratio of highest to lowest
luminance. From Table 4, we
see that walking in from sunlight to a space with a luminous ceiling
decreases the dynamic range by a factor of about 10,000.
Table
4---Highlight luminance & dynamic range
|
Light Source
|
Highlight Luminance
|
Dynamic Range
|
Unfr.
60 W
|
25,000
|
2,500,000
|
Sun
|
1900
|
190,000
|
Ord.
Fr. 60 W
|
1600
|
160,000
|
Soft
White
|
210
|
21,000
|
1
Fluor. Tube
|
11
|
1100
|
Lum.
Ceiling
|
0.05
|
20
|
These calculations concerning amplitudes of veiling reflections and
highlights, and their effect on dynamic range can be reduced to
man-in-the-street terms. Suppose that the man in the street is standing
in front of a drugstore, diffusely lit by fluorescent lamps, looking in
the plate glass windows. Suppose that it's a clear day, but the sun is
fairly low in the western sky, so that the mean luminance of the
outdoor scene is equal to that inside the drugstore. What the man in
the street will see, or what you and I will see is that the scene in
the drugstore looks washed out, compared to the scene outdoors.
What we now understand from calculation is that the drugstore does not
look washed out for some mysterious reason involving fluorescence of
the crystalline lens, or flicker, or some quirk of the visual system.
It looks washed out because it is washed out. Highlights are dim and
large; blacks and saturated colors are covered by veiling reflections.
This is in addition to the loss of color contrast because of the
inferior color rendering of fluorescent lights, the loss of black-white
contrast because of the lack of shadows in the drugstore, and the
enhancement of color contrast outdoors due to the fact that light from
the west is reddish while that from the east is bluish.
Summary
and conclusions
The examples of the mirror object and the eclipsed sun show that in
general everything about a light source's size and shape can matter.
One important form of variation among lights is their size. This paper
has concentrated primarily on the role of source size, and its
interaction with reflections from shiny objects. For a specified
illuminance, lights must vary in size because they vary in luminance.
Veiling reflections are never negligible; in colored objects, they
cause a loss of deep colors. Highlights, reflections of the light
source, can be an important source of contrast and information in a
scene. With a compact source such as the sun, highlights will appear as
points in highly curved surfaces, but will have a size and shape in
objects of greater radius of curvature. When a luminous ceiling is the
source, highlights do not exist, only a nearly unavoidable veiling
reflection. The result is a huge reduction in the dynamic range of a
scene.
Many simplifying assumptions have been made in order to create a simple
picture of the effects of source size. The quantitative treatment
extended only to reflection from perfectly shiny surfaces. The
small-angle approximation and the example of a circular uniform light
source were used repeatedly. The goal has been to provide a basic
description of some effects of source size, while taking account of
such facts as the luminance variation among light sources, the optics
of image size and image luminance, the eye's limit of angular
resolution, and the way in which object colors are seen.
References
1. Worthey, J. A. 1985. An analytical visual clarity experiment. J. of the IES 15(no. 1):239-251.
2. Worthey, J. A. 1989. Effect of veiling reflections on vision of
colored objects. J of the IES
18(no.
2).
3. Worthey, J. A. 1989. Geometry and amplitude of veiling reflections. J. of the IES 19(no. 2)
5. Martin, L. C. 1932. An
Introduction to Applied Optics, Volume II. Pitman: London. The
general issue of light concentration by optical systems is discussed in
W. T. Welford and R. Winston, The Optics of Nonimaging Concentrators
(Academic, New York, 1978). Any reader who knows of yet another
textbook or article that derives or explains the theorem about image
luminance, is requested to contact
the author.
6. Wyszecki, G. and Stiles, W.S. 1967. Color Science: Concepts and Methods,
Quantitative Data and Formulas, John Wiley: New York.
7. Jenkins, F.A. and White, H.E. 1957. Fundamentals of Optics, Third Edition.
McGraw-Hill: New York.
8. Gilchrist, A.L. and Jacobsen, A. 1983. Lightness constancy through a
veiling luminance. J. Exp. Psych:
Human Perception and Performance 9:926-944.
[Once
again, this article was originally published as: James A. Worthey,
"Lighting quality and light source
size," Journal of the IES 19(2):142-148
(Summer 1990). Color versions of
the photos happened to be available, so those are used above. Figure 3
is slightly updated from the printed version. Figure 2 is a little ugly
above, but is essentially the same as in the original article.
Otherwise editing
has been kept to a minimum. Your
comments are invited. Jim
Worthey, 2005 January 24.]
|