Jim Worthey,
                        Lighting and Color Research
home page contact about me
Jim Worthey • Lighting & Color Research • jim@jimworthey.com • 301-977-3551 • 11 Rye Court, Gaithersburg, MD 20878-1901, USA

Seldom Asked Questions Page

What Does "Orthonormal" Mean?
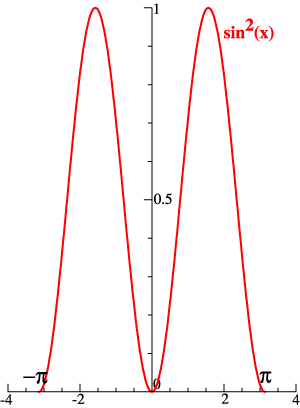
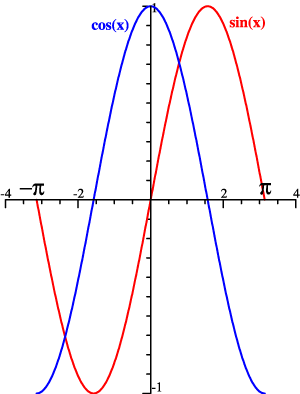
Perpendicular 2-vectors
If 2 vectors are perpendicular, then their dot product is zero:
a•b = a1*b1 + a2*b2 = −2 + 2 = 0   .
Orthogonal means perpendicular, so vectors a and b are orthogonal. A dot product is also called an inner product.

In the example above, the vectors have 2 components, (x, y) . The inner-product formula generalizes to any number of dimensions, and even to continuous functions. As an alternative to the dot, •, an inner product can be indicated with angle brackets, 〈〉:
inner prod definition

 For an example with continuous functions, sin(x) is orthogonal to cos(x).
sin & cos graphed
sin * cos graphed
sine squared
sine and cosine functions
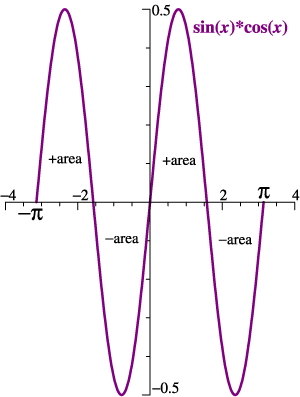
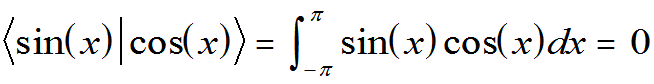
When sin(x) and cos(x) are multiplied, 
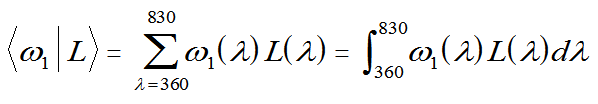
the graph has equal + and − areas. 〈sin(x)|cos(x)〉 = 0, see below.
On the other hand, 〈sin(x)|sin(x)〉 = π .
inner product of sin(x), cos(x)

So, sin(x) and cos(x) are orthogonal, but they are not normalized. A function f(x) is normalized if  〈f(x)|f(x)〉 = 1. On the other hand, 〈sin(x)|sin(x)〉 = π, see above. If we define a new function s(x) = π0.5sin(x), then 〈s(x)|s(x)〉 =  1. Function s(x) is normalized.
If a set of functions, such as ω1, ω2, ω3, are orthogonal to each other, but each of them is normalized, then they are an orthonormal set. A set of orthonormal functions is a powerful tool for deriving needed formulas in the simplest form.


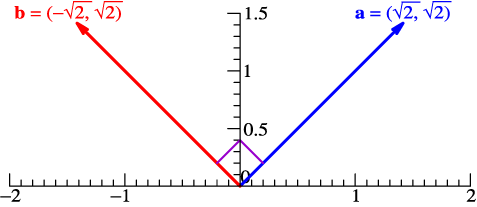
Why the Tristimulus Vector is the Best Measure of Stimulus Amplitude.
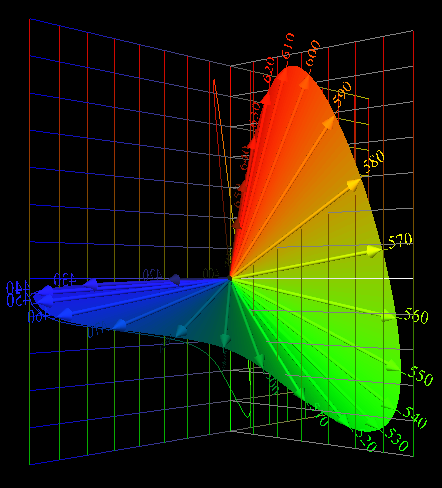
The orthonormal color matching functions map lights into a color space, as pictured at right. Monochromatic lights of unit power map to the Locus of Unit Monochromats.  Jozef B. Cohen said that this Locus represents the "true structure of color space."

Without challenging Cohen's insight, it is interesting to seek a more step-by-step explanation. Why are tristimulus vectors computed using the orthonormal basis the best measure of color stimuli, including stimulus amplitude? Some of the answers are verbal and intuitive; others relate to linear algebra and what Cohen called "the fundamental metamer."

The term "basis functions" is used here and elsewhere as a synonym for "orthonormal color matching functions."
 
Locus of unit
              monochromats
1. Because the basis functions are orthogonal, they are sensitivities for independent features of the stimulus. The achromatic, or whiteness function, ω1, is all-positive, so the first component of the tristimulus vector will be a positive number. The second tristimulus value measures redness or greenness. The third tristimulus value measures blueness versus yellowness, although no light goes very far "yellow" by this measure.

A person may well object that red, green and so forth are psychological dimensions that should be decided by an observer, whereas this color space was cooked up using mathematical ideas. The objection is correct! We could go further and point out that the Prime Colors, which loom large in this space, are not synonymous with such important psychological landmarks as unique red, unique green, etc. The color-mixing stage of vision plays its own unique role. As Cornsweet explained it, the color-mixing, or transduction stage acts to lose information. If a mixture of narrow-band red and narrow-band green makes a match to narrow-band yellow, then the eye has lost the information that the mixture stimulus is physically different from the single narrow-band. The color-mixing stage of vision is about matches and mismatches. The Prime Colors, which technically are Prime Wavelengths, are (approximately) the wavelengths that map to the longest vectors. If we are inventing a technology such as televison, we want to get a signal through the information-losing stage, and we need to know about tristimulus space and Prime Colors. Other issues can then be handled as they arise in later stages of the visual system, and later stages of the discussion.

Anyway, the basis functions themselves map to the axes. Functions that are independent mathematically, and in their intuitive meaning, map to perpendicular directions in the color space. This "makes sense" and is convenient in further analysis. By contrast, X and Y in the CIE scheme are not independent. They come from highly overlapping all-positive functions, x-bar and y-bar.

2. If independent stimulus properties project onto the perpendicular axes, then the components of the tristimulus vector can be added as vector components normally add. That is, the vector's total length is the square root of the sum of the squares of the components. We can call this The Simple Algebraic Explanation.

The simple explanation is valid, but open to some objections. One might say, well, OK, red versus green is independent of whiteness or blueness, but what about scaling? How do we know that we are not giving too much weight, or too little weight, to redness in relation to whiteness? The non-mathematical counter-argument, for persons who do not have color deficiency, is that the 3D graph "looks about right." It has about the same reach in each independent direction. If you agree that a red bell pepper is "really red," and snow is "really white," and so forth, then the scaling is reasonable.

3. The more algebraic answer is essentially the explanation of why the 3D graphic of the locus of unit monochromats indeed looks so reasonable. Recall that there are no adjustable parameters in the development of the color space. One starts with certain functions such as cone sensitivities, but any arbitrariness in their scaling is removed in the steps that generate the orthonormal basis.

The remainder of the more algebraic discussion, for now, is spelled out on a separate page. So click here.


Copyright © 2004 James A. Worthey, email: jim@jimworthey.com
Page last modified, 2013 April 21