|
 |
|
| Jim Worthey • Lighting & Color Research • jim@jimworthey.com • 301-977-3551 • 11 Rye Court, Gaithersburg, MD 20878-1901, USA |
|
|||||||
|
|
||||
|
| 3 Main Ideas |
 |
 |
 |
|
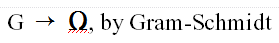
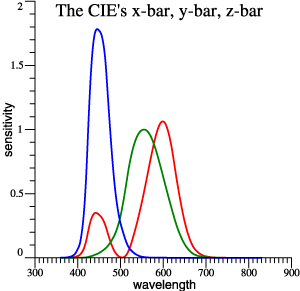
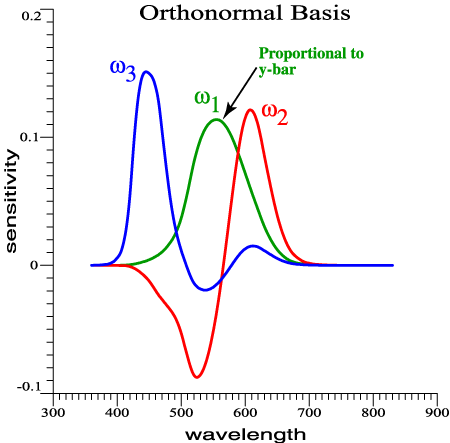
Orthonormal
Color Matching Functions.
|
Vectorial Sensitivity to narrow-band lights. |
Tristimulus vectors
in Cohen's space. |
| Quick Example:
Color Loss with Mercury Vapor Light. |
 |
 |
| 2 Lights That Match, with
Dissimilar Spectra |
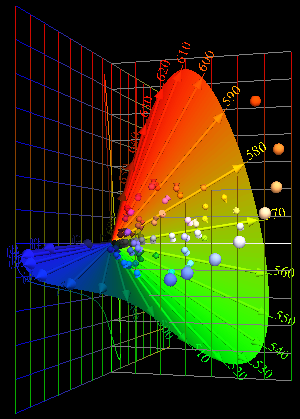
Shifts
of
64 Munsell Papers in Cohen's space when
Daylight --> High
Pressure Mercury Vapor
|
| Early
Color-Matching Data of Guild or Wright. |
| Thoughts on Matching Data |
The primary
lights are not unique, and the same facts can be
presented in alternate sets of graphs, an awkward
situation. However,
|
| Same Color Matches, but the Functions Look Different: |
 |
 |
 |
| (x, y) Diagram |
| So, we think in terms of the chromaticity diagram... | 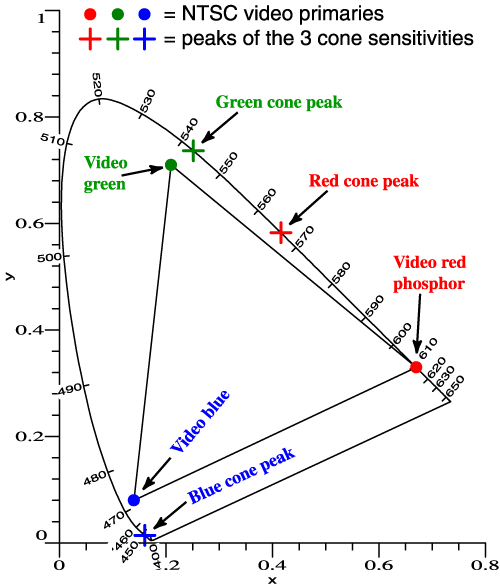 |
but
those primary colors are still needed. |
| Which Wavelengths Act Most Strongly in Mixtures? |
| MacAdam, and later Thornton did
calculations like this. Narrow-band lights of constant power are mixed with equal energy light. Some wavelengths perturb the white chromaticity more than others. Thornton coined the term "Prime Colors" for the 3 wavelengths that act most strongly. |
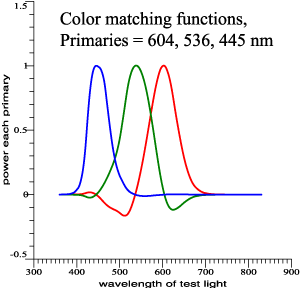
| Color Matching Functions
Are in Fact Relatively Stable When the Primary Wavelengths Are Changed. |
|
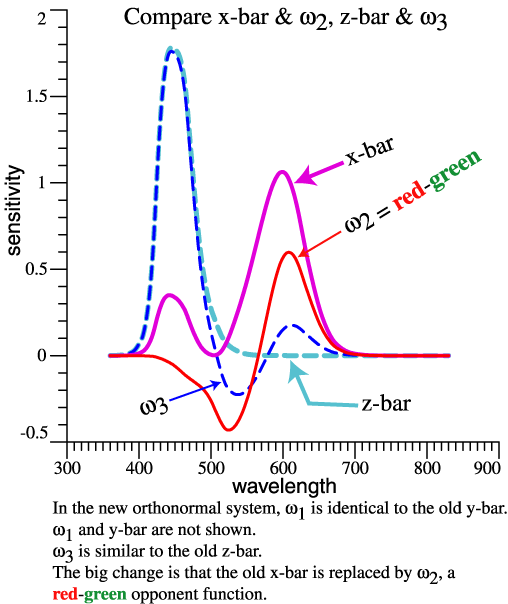
Later Thornton found:
Michael
Brill's new theorem:
When
one primary wavelength is changed (say the red
wavelength only) then the associated (red) color
matching function changes only in scale, not in
shape.(For a more leisurely discussion of shifting primary wavelengths, please click here.) |
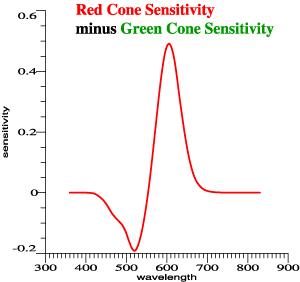
| Red and Green Primaries
Must Relate to the Overlap of Red and Green
Sensitivities... |
 |
 |
 |
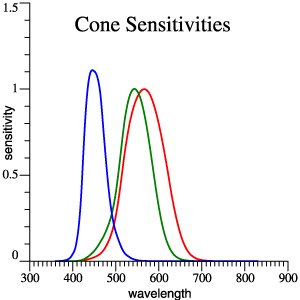
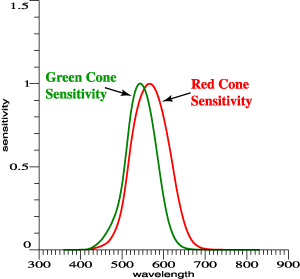
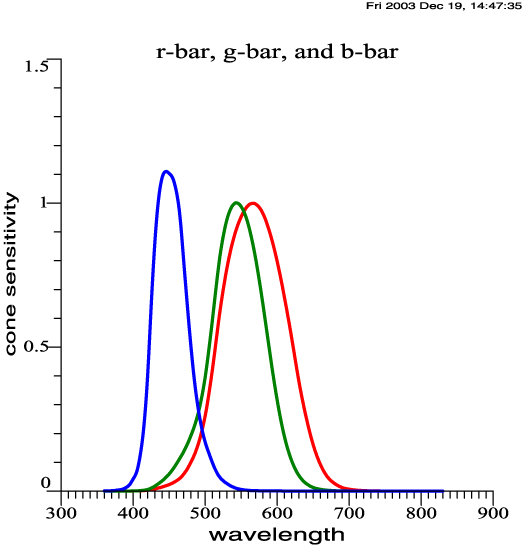
| Red and green cone functions are
highly overlapping. |
Subtracting green from red gives
peaks to account for Prime Colors, but the scaling
is arbitrary. |
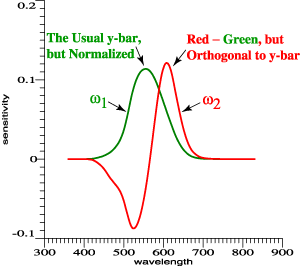
Achromatic sensitivity, y-bar,
is a linear combination of red and green. Find a
second combination that is orthogonal to it. |
| One Degree of Freedom
Remains, to Re-mix ω1 and ω2, But Keep the Mixtures Orthogonal. |
| |
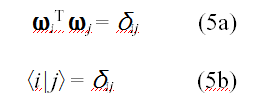
We start with ω1
and ω2, which are linear combinations of
red and green cone functions, and are orthonormal.
Other orthonormal pairs of functions can be generated
by a rotation matrix: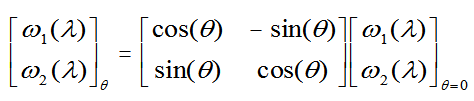 |
| Now Make a Parametric
Plot of ω2 vs ω1. Bingo, the Shape is Invariant. |
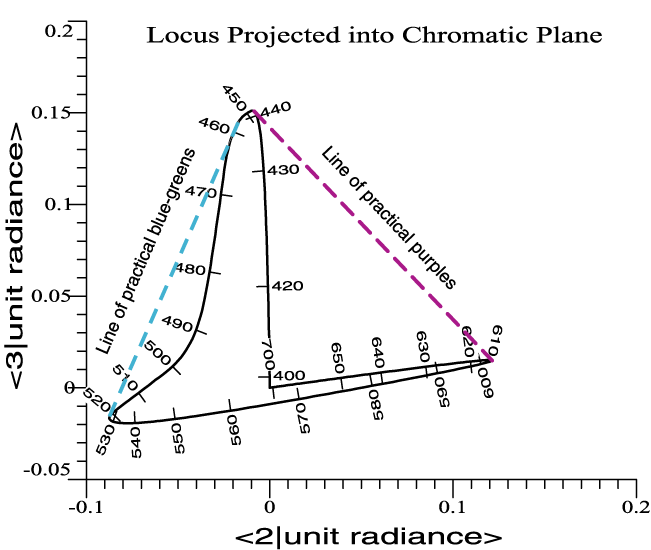
| Vectorial Sensitivity
to Wavelength. |
| For each λ, the eye's
sensitivity is a vector, (ω2, ω1) . The spectrum locus is the eye's vectorial sensitivity to color. It is not a boundary. The spectrum locus is alternatively the vectorial color of narrow-band lights, at unit power. |
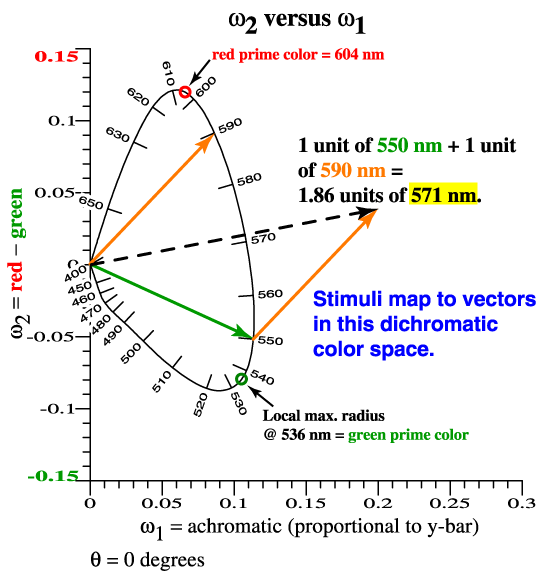 |
Prime colors ≈ the wavelengths where radius is a local maximum. The exact Prime Color is a little different. |
| Stalking Prime Colors
in the 2 Dimensions of Red and Green. |
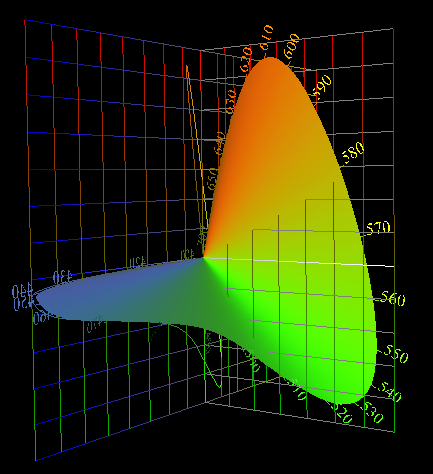
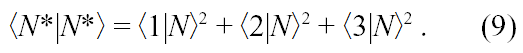
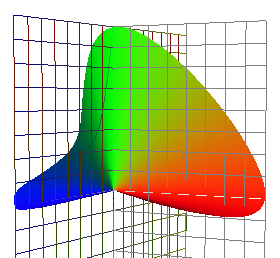
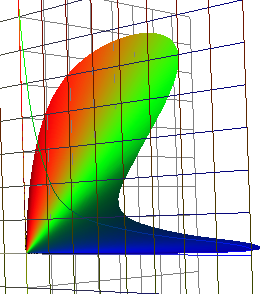
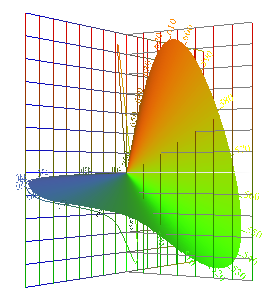
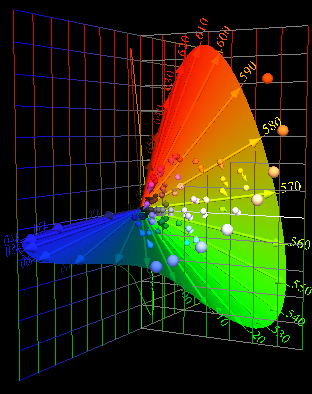
| Vectorial Sensitivity
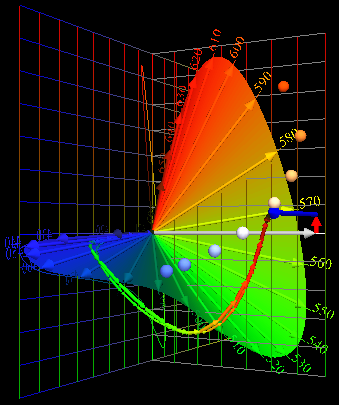
to Wavelength, Now in 3 Dimensions. |
 |
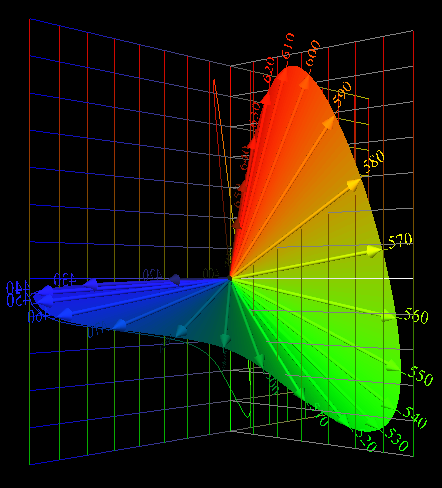 |
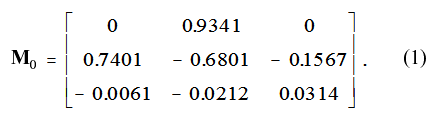
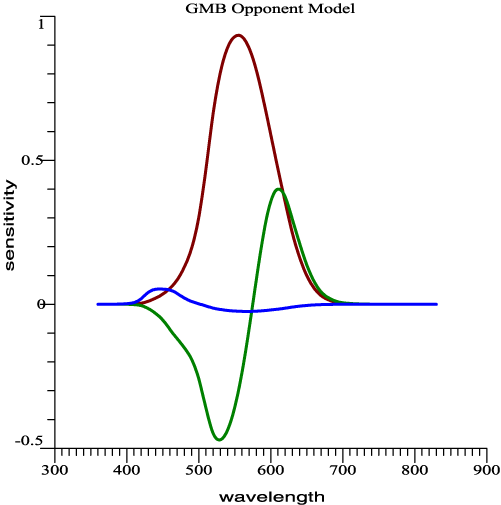
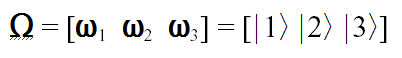
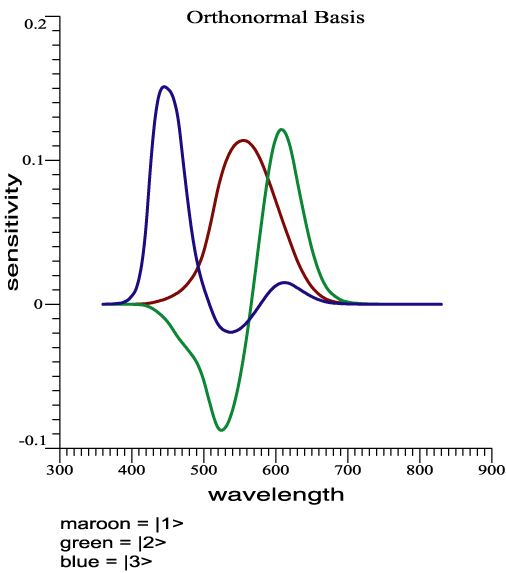
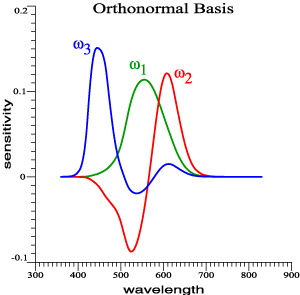
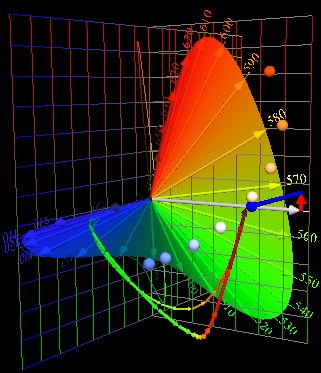
| Now include the blue cones
to create a set of 3 orthonormal color matching
functions. |
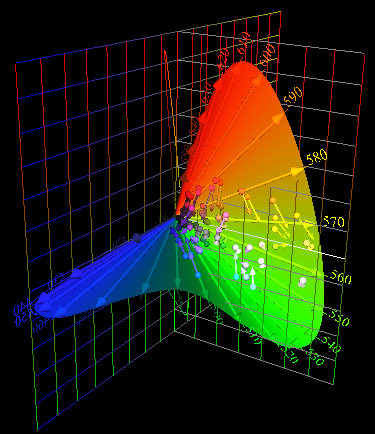
Combining the
orthonormal functions into a parametric plot
yields Jozef Cohen's "Locus of Unit Monochromats,"
the eye's Vectorial Sensitivity to Wavelength. |
| Features of the
Orthonormal System |
| Working Class
Summary of the Orthonormal System |
The discussion started by seeking the
wavelengths where the cone sensitivities are "the
most different," and that idea evolved to give an
orthonormal opponent system. Putting aside the fancy
reasoning, what is new or not new about the
orthonormal basis?
|
 |
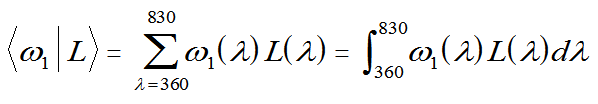
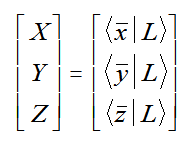
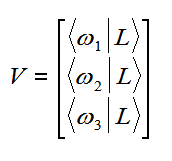
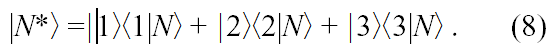
| Oh, Yes,
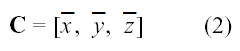
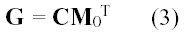
Calculating Tristimulus Vectors. |
Let L be a light, that is a Spectral
Power Distribution.
The
calculation is essentially the same, but the
benefits of the orthonormal color matching
functions are tremendous!
|
| Rearrange the Sums to
Find a Vector for Each Wavelength Band |
 |
 |
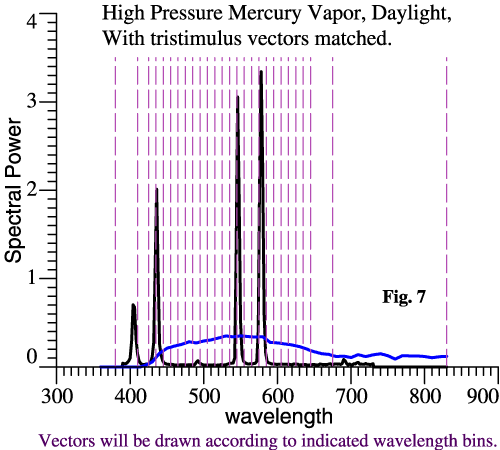
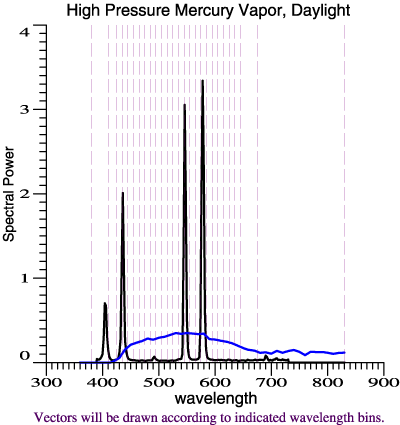
| A daylight phase
has the same tristimulus vector as a certain
high-pressure mercury vapor light. Earlier we saw the effect of the mercury light on 64 paint chips. Now we see it decomposed into its component colors. |
Color Rendering
|
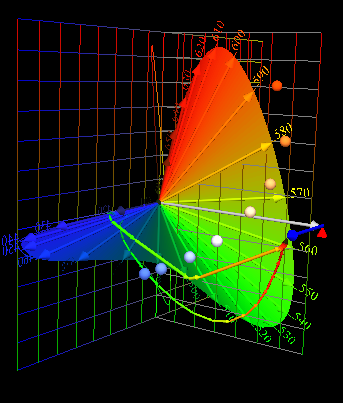
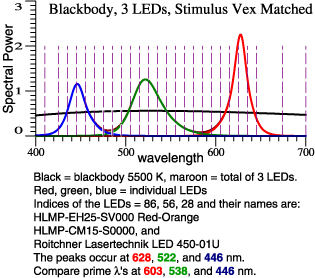
| Pick 3 LEDs Whose Peaks
Are Near the Prime Colors; Combine Them to Match Blackbody 5500 K. |
| Spectra |
Color
Composition |
Transition,
64 Color Chips |
 |
 |
 |
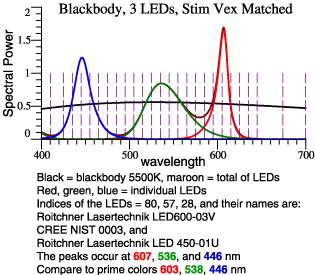
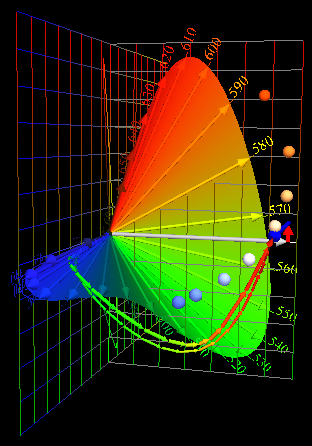
| Pick a redder red LED,
and a greener green One. Again combine them to match Blackbody 5500 K. |
| Spectra |
Color
Composition |
Transition,
64 Color Chips |
 |
 |
 |
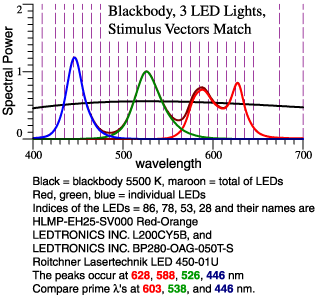
| So, the 2nd LED
combination above doesn't dull reds and greens,
but it exaggerates some of them. Recall Yoshi Ohno's concern that the red prime color (603 nm) is too orange. Address that issue with a double red primary... |
| Spectra |
Color
Composition |
Transition,
64 Color Chips |
 |
 |
 |
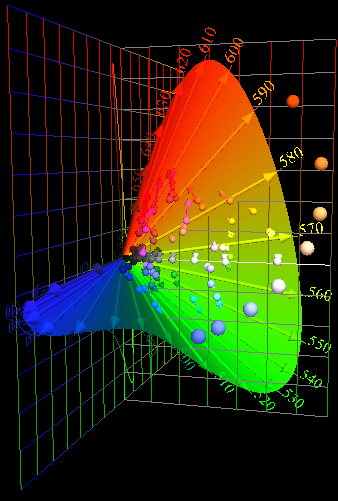
| The orthonormal basis
makes it convenient to present color data as vectors
in Jozef Cohen's linear color space. Vector
operations make use of linearity to do simple
things, such as showing the vector components of a
light's color. The color rendering examples present
facts with no hidden assumptions. Each component
vector, for example, is calculated by traditional
colorimetry, but using the orthonormal basis, rather
than XYZ. |
| More Interesting
Examples |
|
| So,
You
Want a Simple Formula? |
For
color rendering, the usual standard of what we
expect is blackbody radiation, or daylight. Those
lights contain both red and green, and graphing the
vector composition of the light shows a swing in the
green direction, then back in the red direction.
Other lights may have greater or lesser swings to
green and back. A simple measure is the swing
towards green, plus the swing back towards red. If L1
is the spectrum of the light under test, and L0
is an appropriate reference light such as blackbody,
those swings can be summed, and then the ratio
taken. The result g
will be 1.0 if L1
has normal color rendering, and >1 or <1 if it
exaggerates or diminishes red-green contrasts.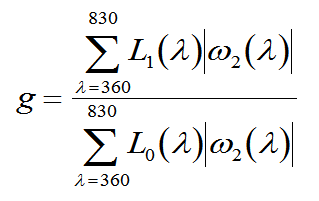 This formula is
not tested, except by the examples above.
|
| Special Credit |
|
William A. Thornton Michael H.
Brill (But
MacAdam gets a demerit for disparaging Cohen's
work.) Calculations
were done with O-matrix software. |
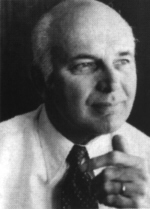
William A. Thornton
|
 Jozef
B. Cohen
|
| Background |
| A draft manuscript
is available on my web site, which talks about
the orthonormal cmf's, Cohen's space, and color
rendering. The title is "Vectorial
Color." Also on my web site is a manuscript that clarifies what Prime Colors are: Michael H. Brill and James A. Worthey, "Color Matching Functions When One Primary Wavelength is Changed". General Background, including Thornton's and Cohen's work is in Render Asking: James A. Worthey, "Color rendering: asking the question," Color Research and Application 28(6):403-412, December 2003. An alternate approach to color rendering, without vector diagrams, is in Render Calc: James A. Worthey, "Color rendering: a calculation that estimates colorimetric shifts," Color Research and Application 29(1):43-56, February 2004. |
| Seldom Asked
Questions (links) |
| Stop |
| Scroll No Farther |
 |
Material Below Addresses Obscure Questions |
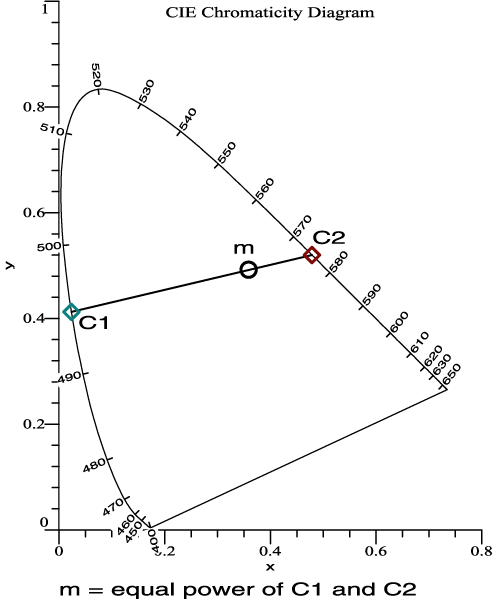
| 2 colors, C1 and C2 are
set to equal power. The mixture is m. |
| Cone Sensitivities,
Approximately Smith-Pokorny Primaries |
|
||
|
|
||
|
|
||
|
|
|
|
|
|||||||||||||
|
|||||||||||||
|
||||||
|
|
|
|
|
||
|
|